
Propulsion sensing, built on measurement
Seeing inside rocket motors
We read what happens inside sealed rocket motors, through the wall and without breaking in. Evandor’s Electrical Capacitance Tomography platform is being developed to resolve internal change across manufacturing, testing and service-life surveillance. Wherever a propulsion article keeps its most important condition out of sight, Evandor aims to make it measurable.
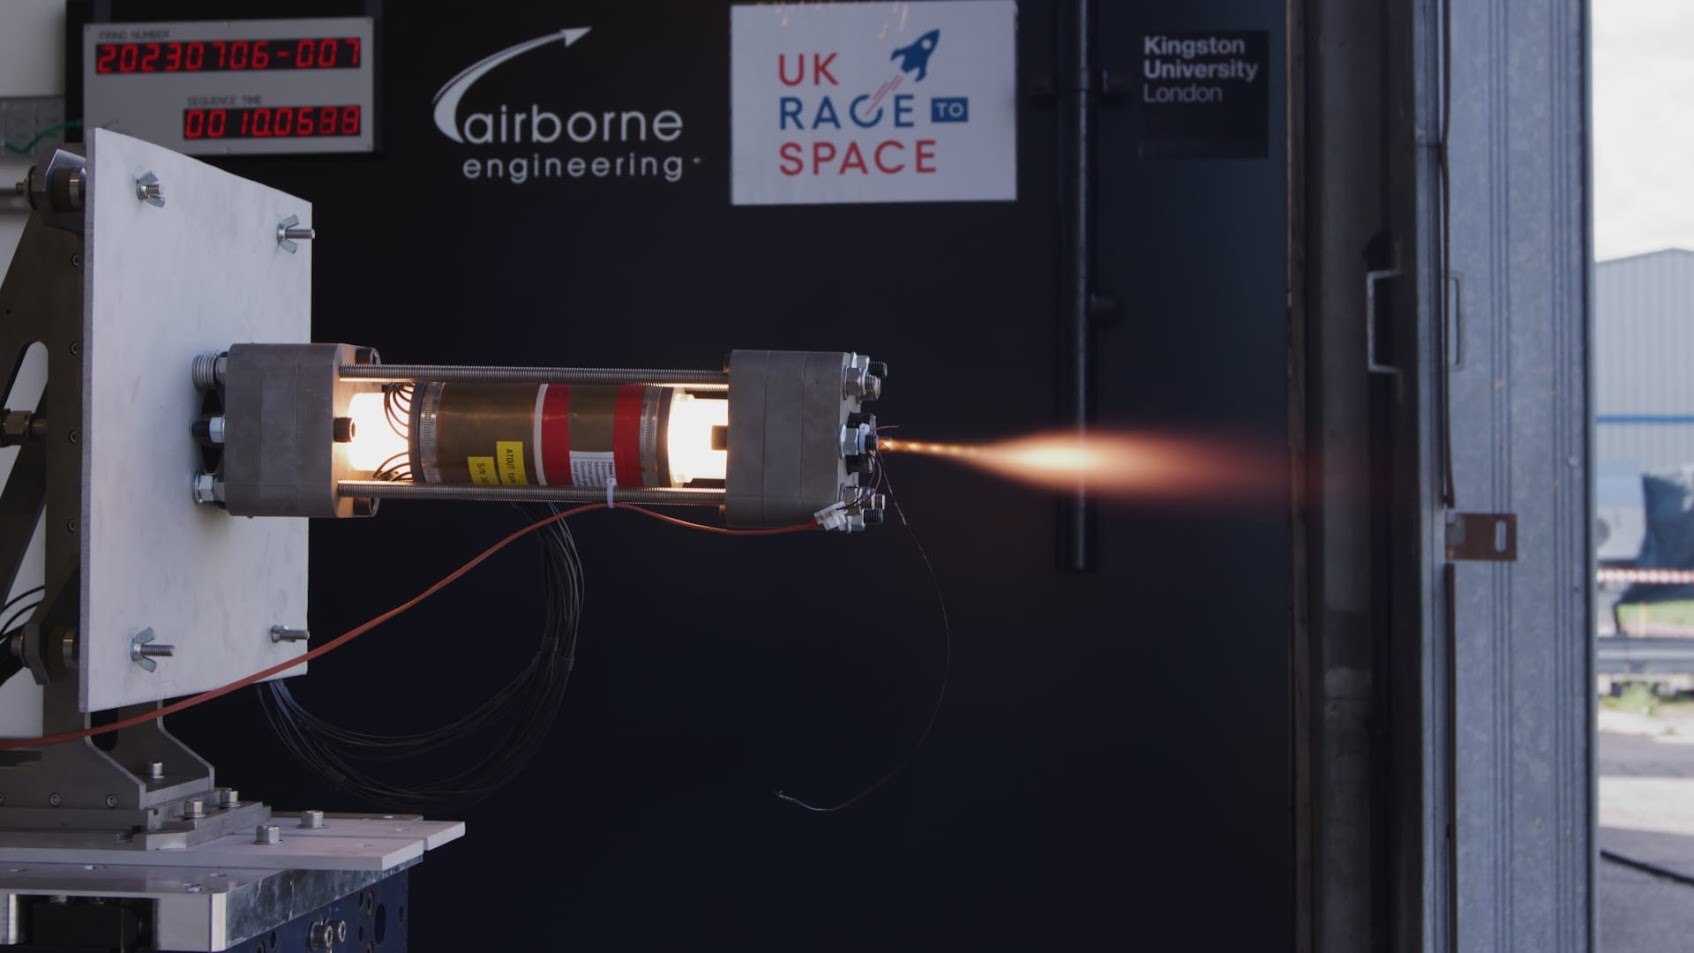
A motor under test. A test firing of the MACAW hybrid rocket featuring an integrated ECT sensor, stemming from research conducted by the founding team at Kingston University London.
Our mission
Facts, not estimates.
A propulsion article’s most important state is often the least directly observed.
Manufacturing defects, material changes in storage and behaviour during firing all influence confidence in the same motor. Evandor is developing a measurement layer that follows the article itself, so teams can build evidence over time rather than rely on isolated inspection moments alone.
See what we measureOne motor. A series of critical decisions.
Applications under development span the propulsion lifecycle rather than a single inspection gate.
01 / BUILD
Manufacture
Understand material distribution and investigate anomalies during processing, cure and integration.
02 / ACCEPT
Qualification
Compare an article against a recorded baseline before it enters service or formal test.
03 / MAINTAIN
Storage
Track condition changes over time to support evidence-led surveillance decisions.
04 / FIRE
Flight
Capture internal response alongside conventional propulsion instrumentation.
01The platform
A thin sensor.
A deeper picture.
The physical interface is simple; the analysis makes the measurement useful.
An array of electrodes senses changes across the motor cross-section. Acquisition electronics retain raw capacitance data, while Evandor’s software reconstructs internal distribution and compares measurements over time. The same dataset can support imagery, derived indicators and longer-term trend analysis.
Understand the measurement methodMake internal condition measurable
We work with propulsion manufacturers, test teams and research partners to define practical demonstrations and validation programmes.
[email protected]